
Thawing Out the Numbers: Q4 2025 Industrial Review


Understanding the evolving dynamics of the industrial real estate sector is critical for investors, as movements in rents, vacancies, new supply, and demographic patterns shape asset performance and capital allocation strategies. To assist in providing a clear, data-driven perspective, we analyzed the sixty-nine U.S. industrial markets with more than $10 billion in total asset value, as defined by CoStar1. This quarter's analysis reflects two additions to the markets above $10B threshold: Lakeland, FL, a fast-growing logistics hub in the Tampa Bay corridor, and Lakewood-New Brunswick, NJ, which has been newly defined by CoStar and brings meaningful industrial density to the New Jersey coverage area.
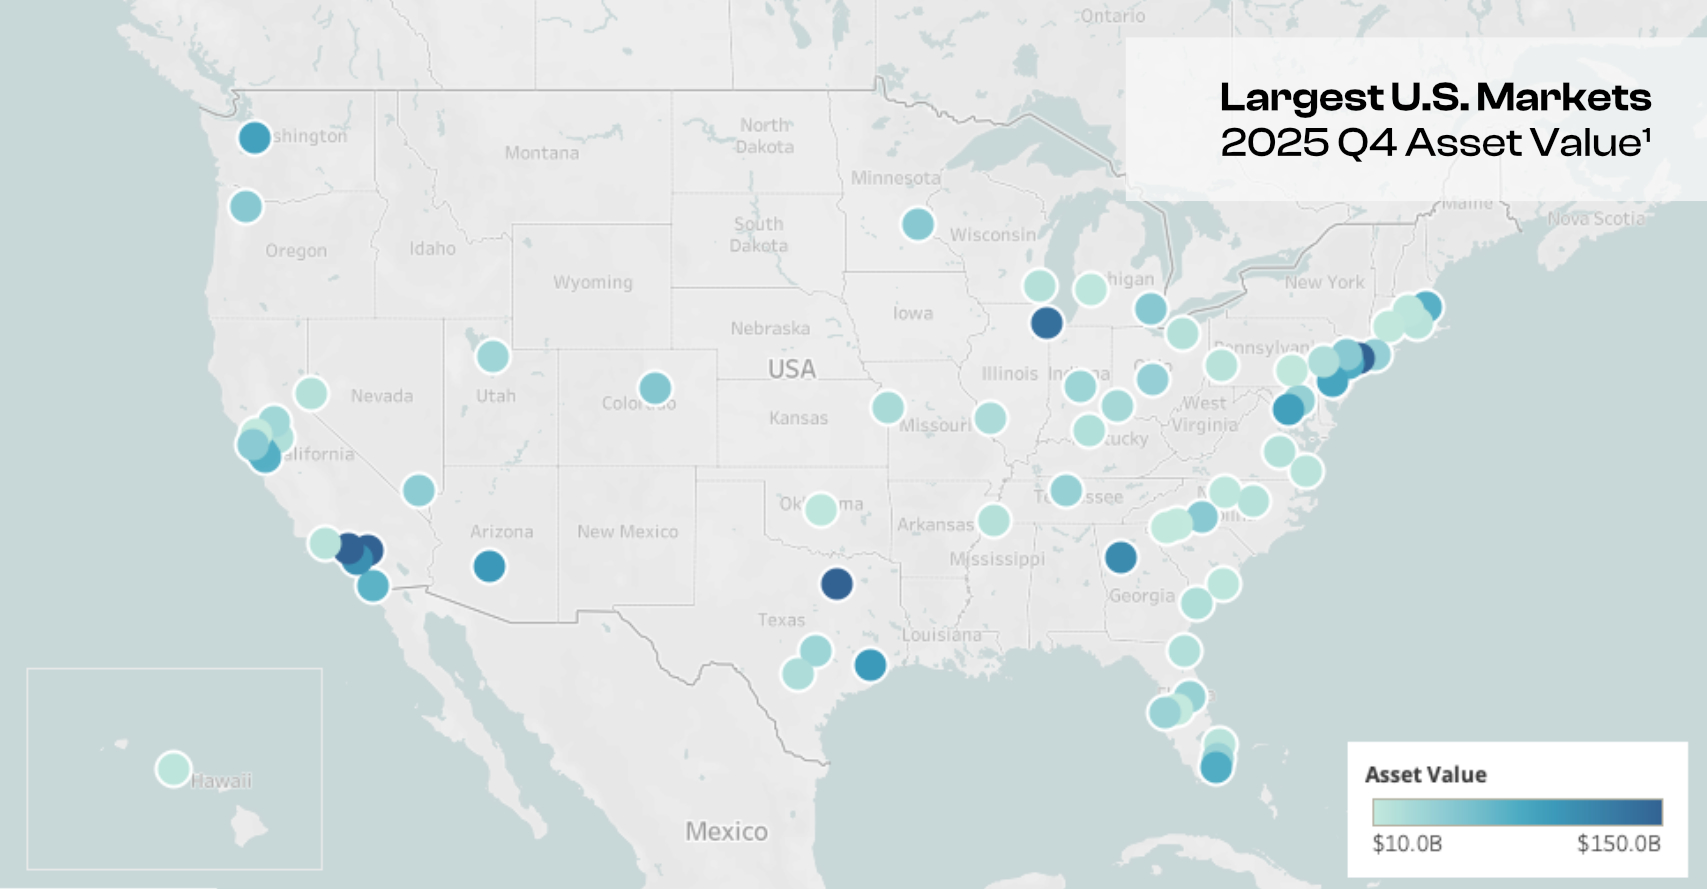
Q4 2025 Industrial Markets above $10B Asset Value as Defined by CoStar1
Market Rent Growth
Market rent growth continued its positive trajectory in Q4, with leading markets sustaining momentum heading into year-end. Savannah, Washington DC, and Chicago paced quarter-over-quarter gains, each adding between $0.11 and $0.23 per square foot, while Columbus and Lakeland also posted solid advances. Quarterly rent growth averaged 0.17%, or 0.70% annualized, reflecting ongoing pricing power across the industrial landscape. On a year-over-year basis, Columbus led the national rankings at 6.40%, followed closely by Louisville at 5.97% and Charlotte at 5.53%, with Washington DC and Saint Louis rounding out the top five. The national year-over-year average came in at 2.23%, a slight moderation from Q3, but nonetheless underscores the durability of rent fundamentals in core logistics and distribution corridors.
Quarter-over-Quarter
- Savannah, GA +1.23% [+$0.11/SF]
- Washington, DC +1.22% [+$0.23/SF]
- Chicago, IL +1.22% [+$0.12/SF]
- Columbus, OH +1.09% [+$0.09/SF]
- Lakeland, FL +1.09% [+$0.10/SF]
- Average +0.17% [+0.70% Annualized]
Year-over-Year
- Columbus, OH +6.40% [+$0.50/SF]
- Louisville, KY +5.97% [+$0.42/SF]
- Charlotte, NC +5.53% [+$0.52/SF]
- Washington, DC +5.18% [+$0.94/SF]
- Saint Louis, MO +5.07% [+$0.36/SF]
- Average +2.23%
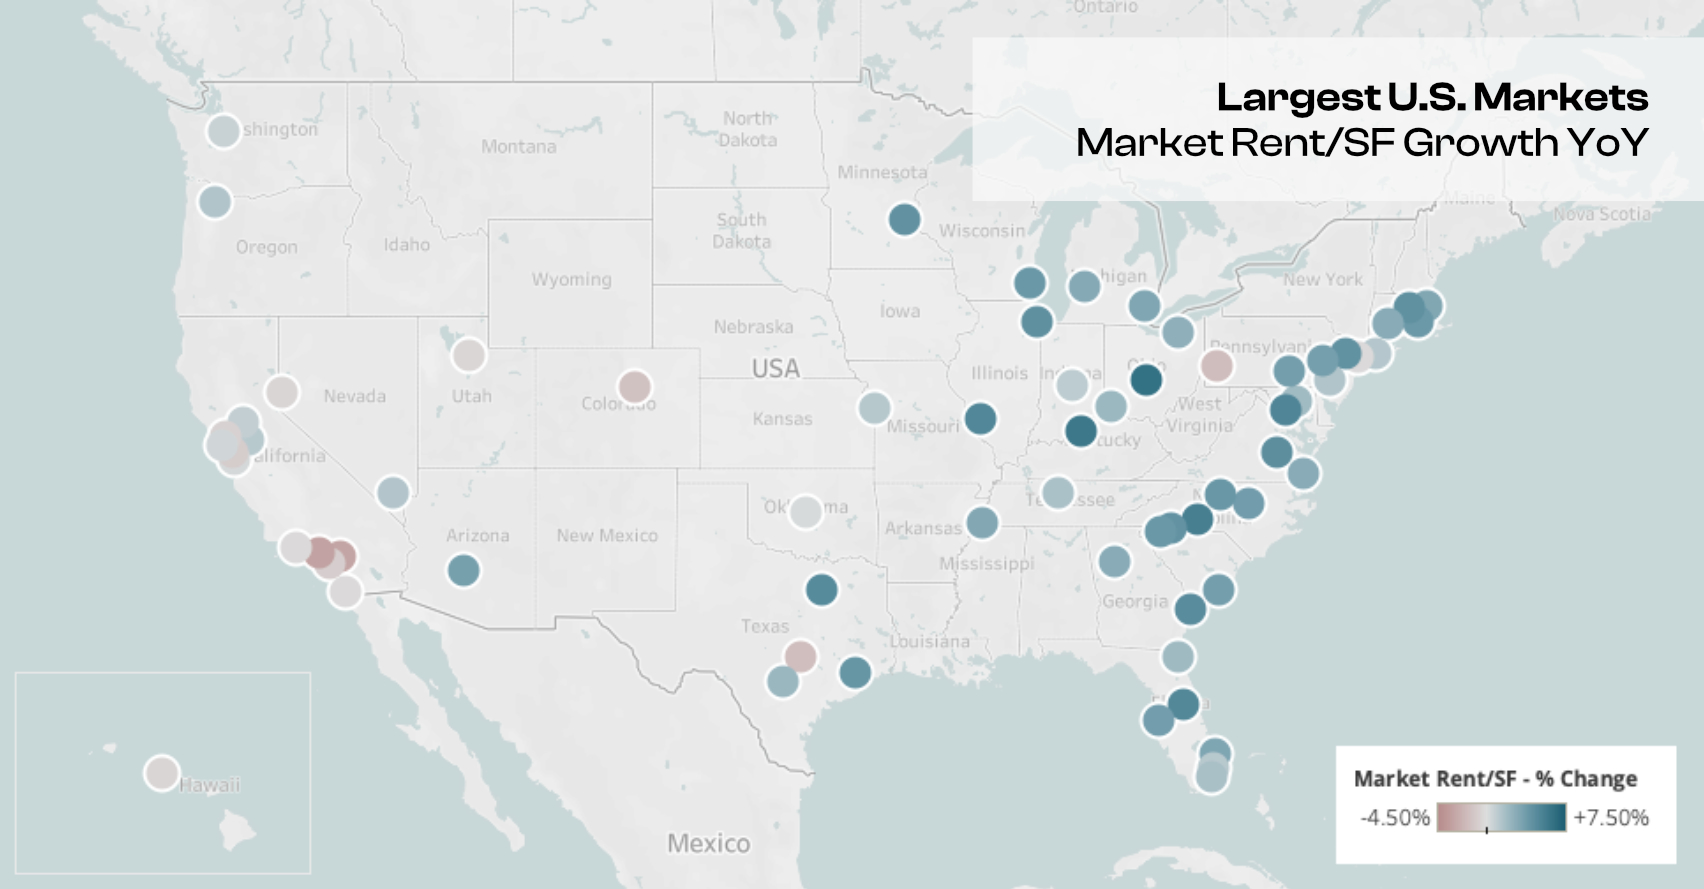
Q4 2025 Quarter-Over-Quarter and Year-Over-Year Growth of Industrial Markets above $10B Asset Value by Market Rent per Sqft. as Defined by CoStar1
Inventory Growth
Supply additions remained active in Q4, with select high-growth markets continuing to attract significant new development. Jacksonville led quarter-over-quarter inventory expansion at 3.75%, adding over 6.3 million square feet, while Savannah, Austin, Greensboro, and Washington DC each posted gains near or above 1.3%. Overall quarterly inventory growth averaged 0.45%, or 1.78% annualized. On a year-over-year basis, Savannah remained the national frontrunner with a 6.33% expansion representing nearly 9.6 million additional square feet, trailed by Austin, Jacksonville, Las Vegas, and Phoenix, markets that continue absorbing deep development pipelines driven by long-term logistics demand. The average national year-over-year average held at 1.49%, consistent with a measured supply cycle that continues to broadly support market fundamentals.
Quarter-over-Quarter
- Jacksonville, FL +3.75% [+6.3M SF, +27 Buildings]
- Savannah, GA +1.36% [+2.2M SF, +9 Buildings]
- Austin, TX +1.32% [+2.3M SF, +54 Buildings]
- Greensboro, NC +1.30% [+2.3M SF, +5 Buildings]
- Washington, DC +1.28% [+4.1M SF, +18 Buildings]
- Average +0.45% [+1.78% Annualized]
Year-over-Year
- Savannah, GA +6.33% [+9.6M SF, +24 Buildings]
- Austin, TX +5.86% [+9.8M SF, +169 Buildings]
- Jacksonville, FL +5.66% [+9.4M SF, +55 Buildings]
- Las Vegas, NV +4.97% [+9.4M SF, +97 Buildings]
- Phoenix, AZ +4.35% [+21.6M SF, +132 Buildings]
- Average +1.49%
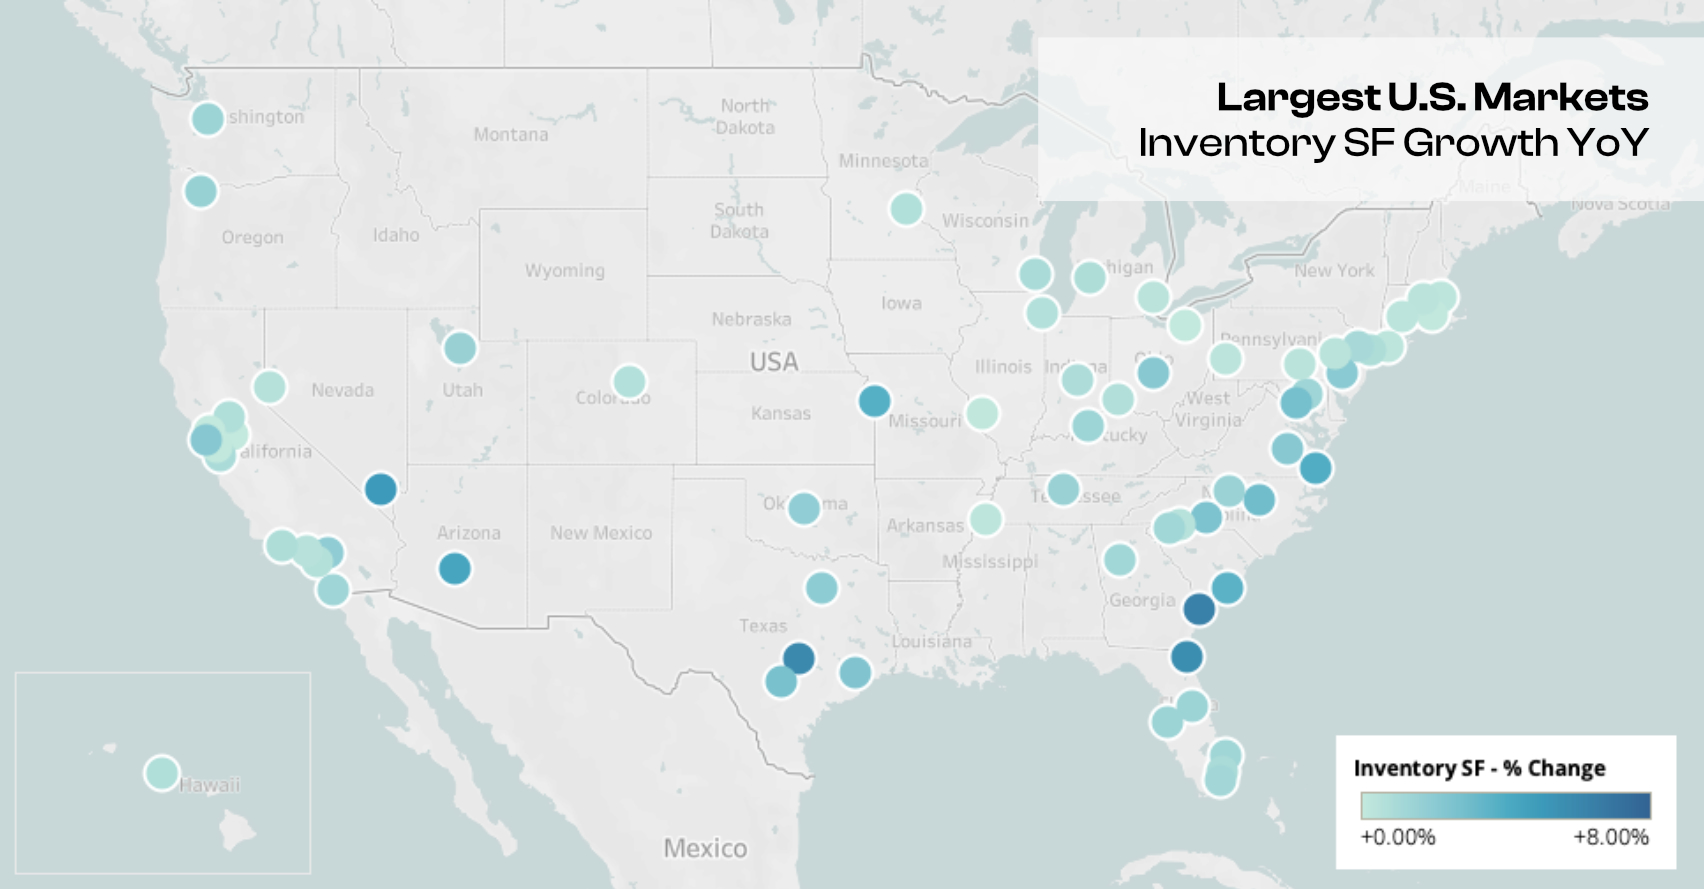
Q4 2025 Quarter-Over-Quarter and Year-Over-Year Growth of Industrial Markets above $10B Asset Value by Inventory Sqft. as Defined by CoStar1
Vacancy Rate Change
Vacancy trends showed encouraging improvement across several key markets in Q4, even as the national average stabilized. Indianapolis recorded the sharpest quarter-over-quarter decline at -0.95 percentage points, followed by Stockton, Memphis, Raleigh, and Orlando, all of which posted meaningful tightening. The quarterly average edged up just 0.06 percentage points, annualizing at approximately 0.26%, a signal of broad-based stabilization. On a year-over-year basis, Spartanburg led all markets with a 3.92-point reduction, followed by Columbus, Lakeland, Indianapolis, and Cincinnati which each saw their rates compress meaningfully. The average vacancy rate of the sixty-nine top markets ended Q4 at 7.61%, broadly in line with Q3 and reflective of a market finding its footing as the prior supply wave continues to be absorbed.
Quarter-over-Quarter
- Indianapolis, IN -0.95% [2025 Q4: 8.2%]
- Stockton, CA -0.82% [2025 Q4: 10.0%]
- Memphis, TN -0.69% [2025 Q4: 8.9%]
- Raleigh, NC -0.67% [2025 Q4: 6.1%]
- Orlando, FL -0.60% [2025 Q4: 7.6%]
- Average +0.06% [+0.26% Annualized]
Year-over-Year
- Spartanburg, SC -3.92% [2025 Q4: 11.0%]
- Columbus, OH -1.46% [2025 Q4: 6.7%]
- Lakeland, FL -1.36% [2025 Q4: 6.9%]
- Indianapolis, IN -1.35% [2025 Q4: 8.2%]
- Cincinnati, OH -0.79% [2025 Q4: 5.3%]
- Average +0.72% [2025 Q4: 7.61%]
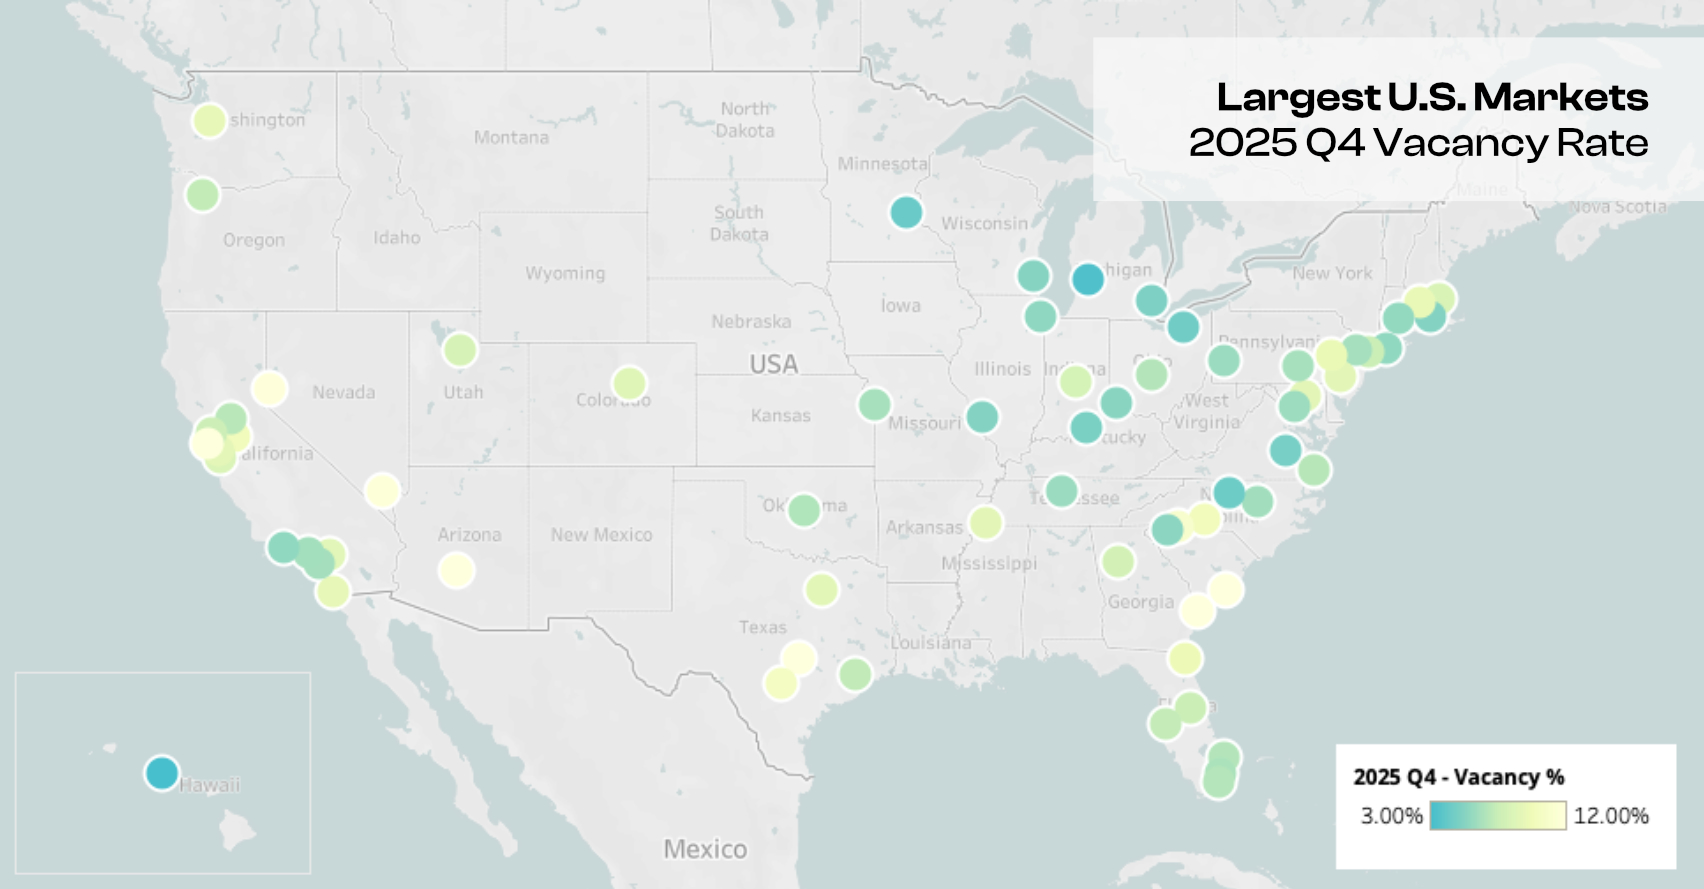
Q4 2025 Quarter-Over-Quarter and Year-Over-Year Growth of Industrial Markets above $10B Asset Value by Vacancy Rate as Defined by CoStar1
Industrial Employment Growth
Industrial-related employment demonstrated continued strength in several key metros despite a modest national average decline. Honolulu, Richmond, and Salt Lake City led year-over-year gains with increases of 3.01%, 2.40%, and 1.85%, respectively, while Miami and Austin also posted positive results above 1.3%. The overall average across tracked markets registered at -0.38%, reflecting ongoing normalization following the elevated hiring activity of prior years. Outperformance in these metros, particularly across logistics-adjacent and manufacturing corridors, points to sustained structural demand for industrial labor in markets with strong underlying economic fundamentals.
Year-over-Year
- Honolulu, HI +3.01% [+1.2K Employees]
- Richmond, VA +2.40% [+1.8K Employees]
- Salt Lake City, UT +1.85% [+2.3K Employees]
- Miami, FL +1.52% [+1.7K Employees]
- Austin, TX +1.39% [+2.3K Employees]
- Average -0.38%
Q4 2025 Year-Over-Year Growth of Industrial Markets above $10B Asset Value by Industrial Employment as Defined by CoStar1
Population Growth
Population growth continued to provide a constructive long-term tailwind for industrial demand, with Sunbelt and Southeast markets again leading the national rankings. Lakeland, Austin, Raleigh, Charlotte, and Salt Lake City topped the list for year-over-year gains, collectively adding between 14,000 and 42,000 new residents each. The national average registered at 0.57%, reflecting broad-based demographic expansion that continues to underpin occupier activity and investment performance in fast-growing regional economies. These trends reinforce the attractiveness of high-growth markets for both near-term leasing activity and longer-term capital deployment across the industrial sector.
Year-over-Year
- Lakeland, FL +1.68% [+14K People]
- Austin, TX +1.65% [+42K People]
- Raleigh, NC +1.48% [+23K People]
- Charlotte, NC +1.43% [+42K People]
- Salt Lake City, UT +1.28% [+17K People]
- Average +0.57%
Q4 2025 Year-Over-Year Growth of Industrial Markets above $10B Asset Value by Population as Defined by CoStar1
1 Data collected from the CoStar Group.
Disclosures
This material is for informational purposes only and does not constitute investment, legal, or tax advice. Nothing herein should be construed as a recommendation or solicitation to buy or sell any security or investment. Any investment involves risk, including the possible loss of principal. Readers should consult their own advisors before making investment decisions.