
Back to Business: Q2 2025 Industrial Review


For investors, understanding industrial market dynamics is essential, as shifts in rents, vacancies, supply growth, and demographic trends directly influence asset performance and capital deployment decisions. To provide a comprehensive view, we evaluated all major U.S. industrial markets with more than $10 billion in asset value, as defined by CoStar. This coverage now includes three newly qualified markets: Greenville, SC; Spartanburg, SC; and Omaha, NE, bringing the total to sixty-eight top markets nationwide.

Q2 2025 Industrial Markets above $10B Asset Value as Defined by CoStar1
Market Rent Growth
Industrial market rents continued to grow this quarter, though at a more measured pace. Average market rent growth registered at 0.27% in Q2, down from 0.45% growth in Q1. The strongest growth came from Saint Louis at 1.64%, more than six times the national average. Nashville and Milwaukee followed closely, both also ranking among the top annual performers alongside Charlotte, which has consistently placed in the top five quarterly growth markets for three consecutive quarters.
Quarter-over-Quarter
- Saint Louis, MO +1.64% [+$0.12/SF]
- Nashville, TN +1.60% [+$0.19/SF]
- Milwaukee, WI +1.58% [+$0.12/SF]
- Washington, DC +1.41% [+$0.25/SF]
- Charlotte, NC +1.33% [+$0.13/SF]
- Average +0.27% [+1.07% Annualized]
Year-over-Year
- Milwaukee, WI +7.21% [+$0.52/SF]
- Nashville, TN +6.73% [+$0.76/SF]
- Charlotte, NC +6.58% [+$0.61/SF]
- Orlando, FL +6.50% [+$0.89/SF]
- Columbus, OH +6.35% [+$0.50/SF]
- Average +2.96%

Q2 2025 Quarter-Over-Quarter and Year-Over-Year Growth of Industrial Markets above $10B Asset Value by Market Rent per Sqft. as Defined by CoStar1
Inventory Growth
Supply-side expansion held steady, with inventory growing 0.33% in Q2 and 1.87% year-over-year. Savannah once again outpaced all markets, leading quarterly growth for the fourth consecutive quarter at 1.81% and posting a substantial 18.98% annual increase. Kansas City and Raleigh emerged as new entrants to the top five this quarter, while the annual leaders, Savannah, Austin, Las Vegas, Phoenix, and Charleston, continued to dominate.
Quarter-over-Quarter
- Savannah, GA +1.81% [+2.8M SF, +8 Buildings]
- Kansas City, MO +1.32% [+4.9M SF, +5 Buildings]
- Raleigh, NC +1.26% [+1.3M SF, +6 Buildings]
- Austin, TX +1.23% [+2.1M SF, +44 Buildings]
- Las Vegas, NV +0.95% [+1.8M SF, +16 Buildings]
- Average +0.33% [+1.30% Annualized]
Year-over-Year
- Savannah, GA +18.98% [+25.0M SF, +31 Buildings]
- Austin, TX +7.15% [+11.4M SF, +155 Buildings]
- Las Vegas, NV +6.43% [+11.8M SF, +90 Buildings]
- Phoenix, AZ +5.45% [+25.9M SF, +145 Buildings]
- Charleston, SC +4.33% [+4.8M SF, +31 Buildings]
- Average +1.87%

Q2 2025 Quarter-Over-Quarter and Year-Over-Year Growth of Industrial Markets above $10B Asset Value by Inventory Sqft. as Defined by CoStar1
Vacancy Rate Change
Average vacancies increased by 0.33% in Q2 and 1.05% year-over-year, reflecting ongoing supply absorption challenges in some markets. However, several mid-sized markets bucked the trend with notable declines. Greensboro and Reno tied for the largest quarterly vacancy reduction at -0.44%, while Spartanburg led annual declines at -0.60%. Newly added Omaha also posted a meaningful -0.46% annual decrease, bringing its overall vacancy down to just 2.6%.
Quarter-over-Quarter
- Greensboro, NC -0.44% [2025 Q2: 4.4%]
- Reno, NV -0.44% [2025 Q2: 10.7%]
- Spartanburg, SC -0.39% [2025 Q2: 12.1%]
- Washington, DC -0.31% [2025 Q2: 5.7%]
- Lehigh Valley, PA -0.20% [2025 Q2: 7.6%]
- Average +0.33% [+1.33% Annualized]
Year-over-Year
- Spartanburg, SC -0.60% [2025 Q2: 12.1%]
- Saint Louis, MO -0.56% [2025 Q2: 4.2%]
- Omaha, NE -0.46% [2025 Q2: 2.6%]
- Palm Beach, FL -0.36% [2025 Q2: 6.0%]
- Houston, TX -0.32% [2025 Q2: 6.9%]
- Average +1.05% [2025 Q2: 7.39%]
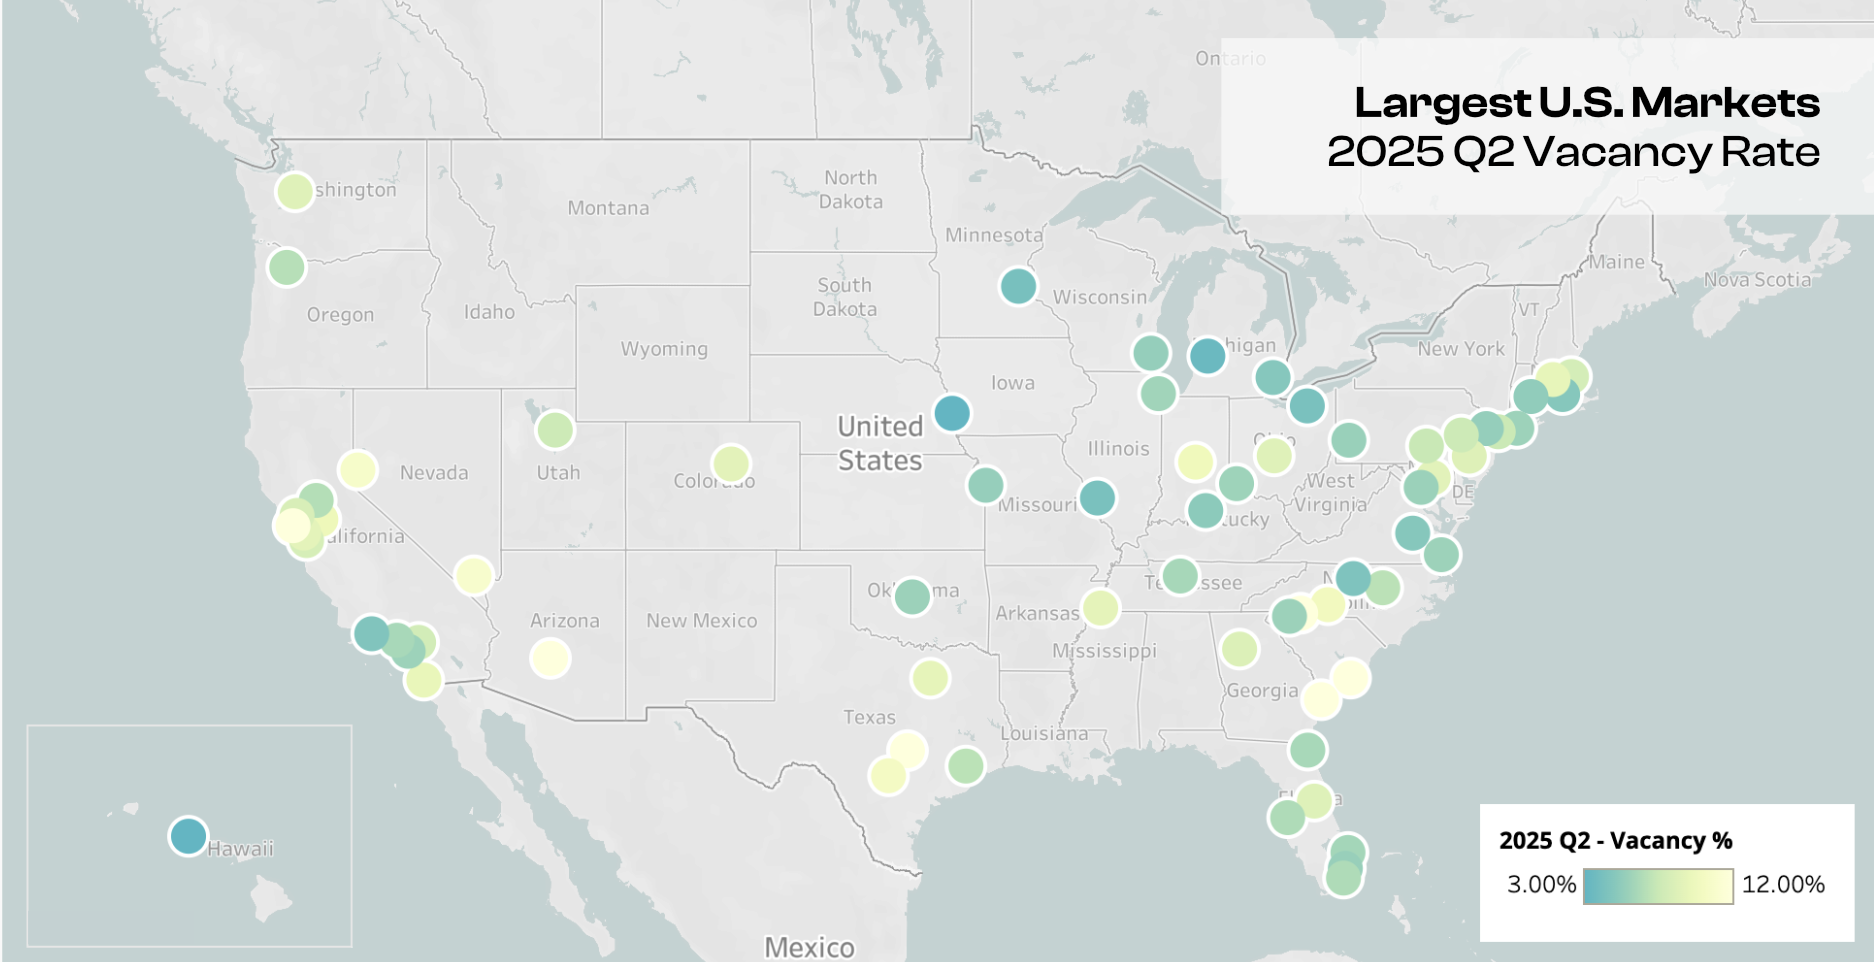
Q2 2025 Quarter-Over-Quarter and Year-Over-Year Growth of Industrial Markets above $10B Asset Value by Vacancy Rate as Defined by CoStar1
Industrial Employment Growth
Employment tied to industrial sectors expanded at a modest pace, averaging 0.17% year-over-year. However, several markets significantly outperformed this national trend. Salt Lake City led all markets with 4.38% annual growth, underscoring its continued momentum, while Miami followed closely at 3.95%, nearly doubling its Q1 rate and reflecting accelerating demand in the Southeast.
Year-over-Year
- Salt Lake City, UT +4.38% [+5.4K Employees]
- Miami, FL +3.95% [+4.2K Employees]
- Greenville, SC +2.88% [+2.4K Employees]
- Cincinnati, OH +2.85% [+5.0K Employees]
- Honolulu, HI +2.67% [+1.0K Employees]
- Average +0.17%
Q2 2025 Year-Over-Year Growth of Industrial Markets above $10B Asset Value by Industrial Employment as Defined by CoStar1
Population Growth
Population growth estimates for the quarter averaged 0.96% annually with the top five markets remaining unchanged from Q1. Orlando led at 2.10%, followed by Austin and Raleigh, while Charlotte and Houston maintained strong momentum, underscoring the Southeast and Sunbelt’s continued demographic tailwinds.
Year-over-Year
- Orlando, FL +2.10% [+61K People]
- Austin, TX +2.05% [+52K People]
- Raleigh, NC +2.01% [+31K People]
- Charlotte, NC +1.91% [+54K People]
- Houston, TX +1.82% [+141K People]
- Average +0.96%
Q2 2025 Year-Over-Year Growth of Industrial Markets above $10B Asset Value by Population as Defined by CoStar1
1 Data collected from the CoStar Group.
Disclosures
This material is for informational purposes only and does not constitute investment, legal, or tax advice. Nothing herein should be construed as a recommendation or solicitation to buy or sell any security or investment. Any investment involves risk, including the possible loss of principal. Readers should consult their own advisors before making investment decisions.