
Winter Winds, Steady Wins: Q3 2025 Industrial Review


Understanding the evolving dynamics of the industrial real estate sector is critical for investors, as movements in rents, vacancies, new supply, and demographic patterns shape asset performance and capital allocation strategies. To assist in providing a clear, data-driven perspective, we analyzed the sixty-seven U.S. industrial markets with more than $10 billion in total asset value, as defined by CoStar.
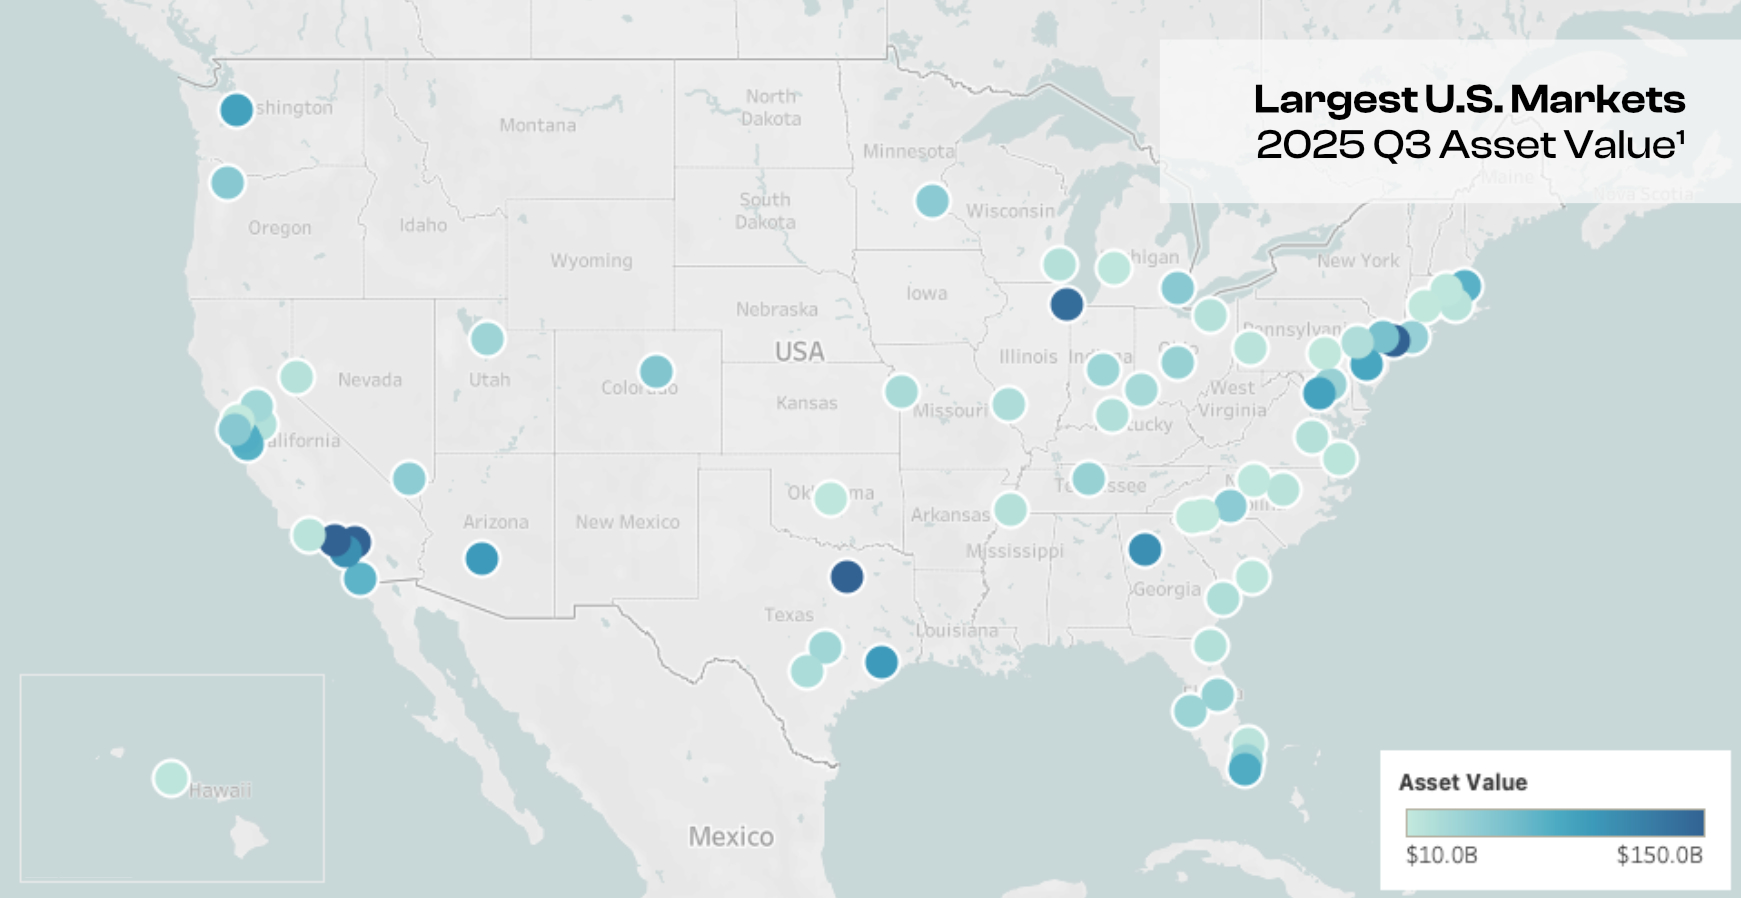
Q3 2025 Industrial Markets above $10B Asset Value as Defined by CoStar1
Market Rent Growth
Market rent growth remained positive across many leading industrial markets in Q3, with several regions continuing to outperform national trends. Richmond and Charlotte led quarter-over-quarter increases at 2.32% and 1.95%, respectively, while Lehigh Valley, Saint Louis, and Harrisburg also posted strong gains. Quarterly rent growth averaged 0.32%, or 1.27% annualized. On a year-over-year basis, Charlotte, Columbus, and Louisville stood out with gains between 6.85% and 7.60%, helping lift the national average to 2.79%. The performance of these high-growth metros continues to underscore durable demand in key logistics and manufacturing hubs.
Quarter-over-Quarter
- Richmond, VA +2.32% [+$0.22/SF]
- Charlotte, NC +1.95% [+$0.19/SF]
- Lehigh Valley, PA +1.84% [+$0.17/SF]
- Saint Louis, MO +1.66% [+$0.12/SF]
- Harrisburg, PA +1.64% [+$0.14/SF]
- Average +0.32% [+1.27% Annualized]
Year-over-Year
- Charlotte, NC +7.60% [+$0.70/SF]
- Columbus, OH +7.02% [+$0.54/SF]
- Louisville, KY +6.85% [+$0.47/SF]
- Orlando, FL +6.18% [+$0.84/SF]
- Richmond, VA +5.67% [+$0.52/SF]
- Average +2.79%
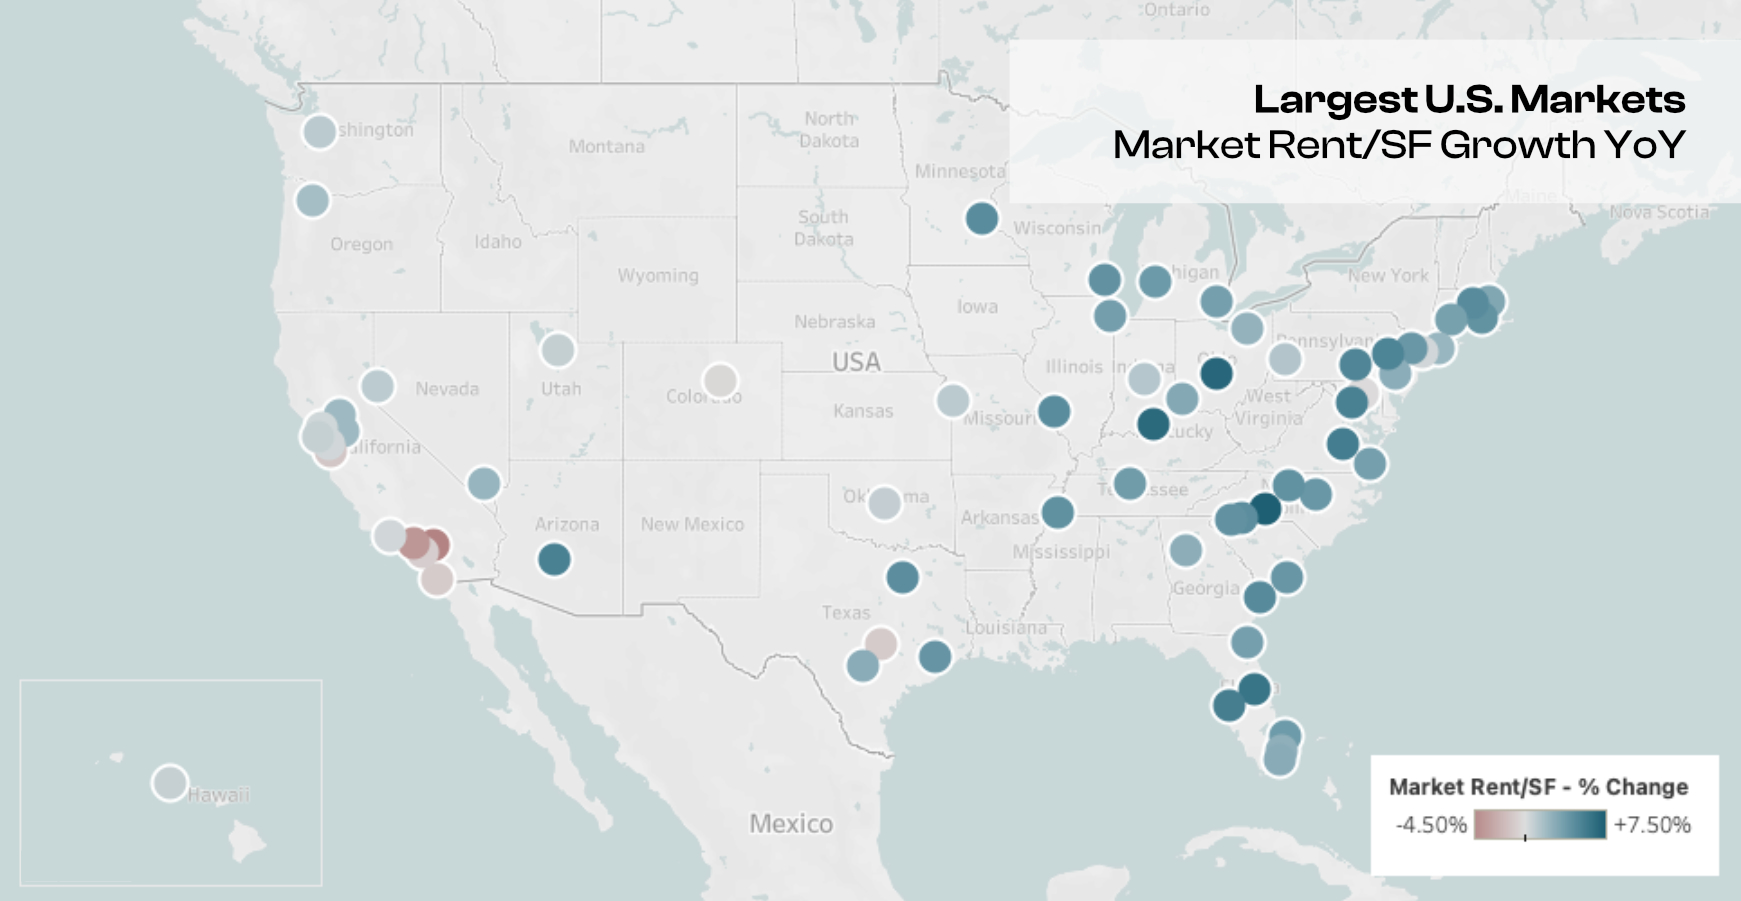
Q3 2025 Quarter-Over-Quarter and Year-Over-Year Growth of Industrial Markets above $10B Asset Value by Market Rent per Sqft. as Defined by CoStar1
Inventory Growth
Supply expansion remained robust in several high-growth industrial corridors this quarter. Savannah once again topped quarter-over-quarter inventory growth at 1.42%, supported by more than 5.3 million square feet of new deliveries. Oklahoma City, Las Vegas, Phoenix, and Charleston followed closely, each adding meaningful new capacity. Overall quarterly inventory growth averaged 0.30%, or 1.19% annualized. Year-over-year trends were similarly strong in Savannah, which posted a substantial 14.56% expansion, along with Austin, Las Vegas, and Phoenix, all of which continue to absorb long-term development pipelines.
Quarter-over-Quarter
- Savannah, GA +1.42% [+5.3M SF, +2 Buildings]
- Oklahoma City, OK +1.13% [+1.7M SF, +16 Buildings]
- Las Vegas. NV +1.12% [+2.2M SF, +22 Buildings]
- Phoenix, AZ +1.08% [+5.5M SF, +35 Buildings]
- Charleston, SC +0.98% [+1.2M SF, +3 Buildings]
- Average +0.30% [+1.19% Annualized]
Year-over-Year
- Savannah, GA +14.56% [+20.2M SF, +19 Buildings]
- Austin, TX +6.90% [+11.2M SF, +166 Buildings]
- Las Vegas, NV +5.74% [+10.7M SF, +96 Buildings]
- Phoenix, AZ +5.09% [+24.6M SF, +141 Buildings]
- Norfolk, VA +3.87% [+5.1M SF, +22 Buildings]
- Average +1.72%

Q3 2025 Quarter-Over-Quarter and Year-Over-Year Growth of Industrial Markets above $10B Asset Value by Inventory Sqft. as Defined by CoStar1
Vacancy Rate Change
Vacancy trends showed meaningful tightening in several major markets, as the national rate continued to stabilize. Columbus recorded the sharpest quarter-over-quarter decline at -1.48%, followed by Spartanburg, Indianapolis, Harrisburg, and Reno, reflecting strong leasing traction in select distribution hubs. Quarterly vacancy movement averaged +0.14%, or +0.54% annualized. On a year-over-year basis, Spartanburg led with a 3.08% reduction, with Reno, Harrisburg, and Columbus also posting notable improvements. National vacancy ended the quarter at an average of 7.60%. These concentrated declines highlight the resilience of tenant demand, particularly in markets where vacancies are normalizing after a wave of recent supply deliveries.
Quarter-over-Quarter
- Columbus, OH -1.48% [2025 Q3: 7.2%]
- Spartanburg, SC -1.14% [2025 Q3: 11.0%]
- Indianapolis, IN -0.72% [2025 Q3: 9.0%]
- Harrisburg, PA -0.61% [2025 Q3: 6.8%]
- Reno, NV -0.60% [2025 Q3: 10.1%]
- Average +0.14% [+0.54% Annualized]
Year-over-Year
- Spartanburg, SC -3.08% [2025 Q3: 11.0%]
- Reno, NV -1.77% [2025 Q3: 10.1%]
- Harrisburg, PA -0.70% [2025 Q3: 6.8%]
- Columbus, OH -0.70% [2025 Q3: 7.2%]
- Dallas-Fort Worth, TX -0.37% [2025 Q3: 9.1%]
- Average +0.98% [2025 Q3: 7.60%]
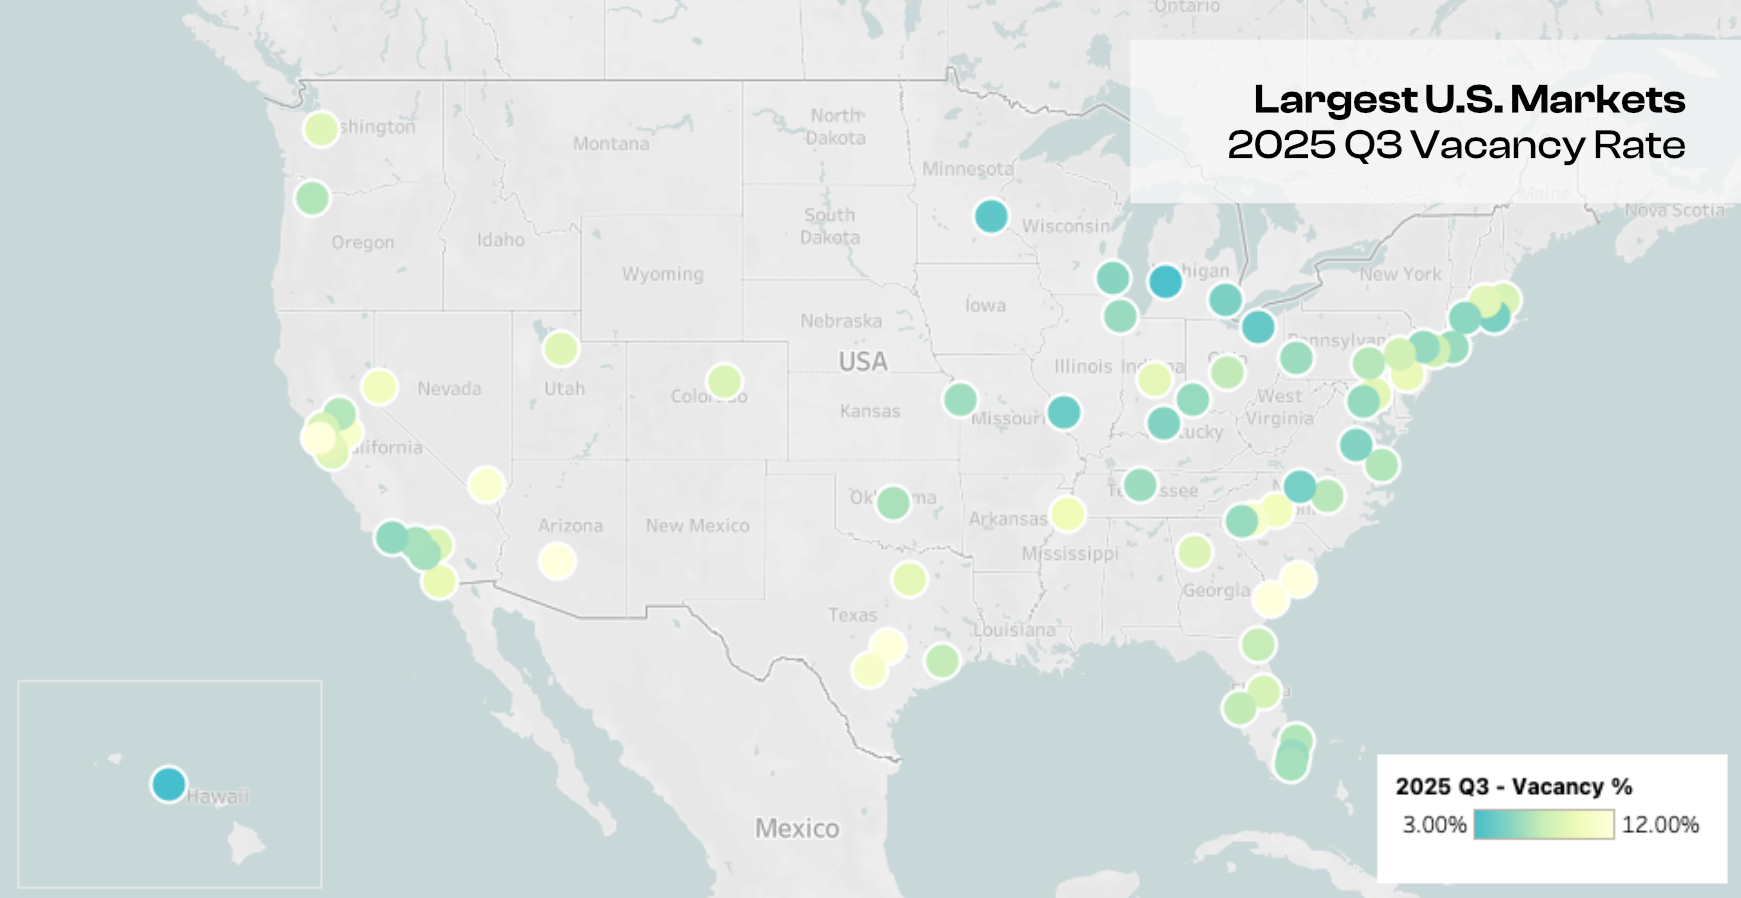
Q3 2025 Quarter-Over-Quarter and Year-Over-Year Growth of Industrial Markets above $10B Asset Value by Vacancy Rate as Defined by CoStar1
Industrial Employment Growth
Industrial-related employment continued to expand in several key metros, even as the national average declined modestly. Honolulu, Richmond, and Salt Lake City led year-over-year employment growth, each posting gains above 2.7%, while Miami and Washington, DC rounded out the top performers. Average employment growth across all major markets registered at -0.39%, reflecting normalization following multiple years of elevated hiring in logistics and manufacturing. Nonetheless, strength in these outperforming markets signals sustained structural demand for industrial labor.
Year-over-Year
- Honolulu, HI +3.07% [+1.2K Employees]
- Richmond, VA +2.77% [+2.1K Employees]
- Salt Lake City, UT +2.71% [+3.4K Employees]
- Miami, FL +2.62% [+2.9K Employees]
- Washington, DC +2.03% [+4.6K Employees]
- Average -0.39%
Q3 2025 Year-Over-Year Growth of Industrial Markets above $10B Asset Value by Industrial Employment as Defined by CoStar1
Population Growth
Population trends continued to support industrial fundamentals, with several Sunbelt and Southeast metros recording strong year-over-year gains. Austin, Raleigh, Charlotte, Orlando, and Charleston led population growth, each adding between 13,000 and 47,000 new residents. The national average increased 0.70%, reaffirming the demographic momentum underpinning industrial demand in fast-growing regional economies. These trends remain an important long-term tailwind for both occupier activity and investment performance.
Year-over-Year
- Austin, TX +1.79% [+46K People]
- Raleigh, NC +1.66% [+26K People]
- Charlotte, NC +1.64% [+47K People]
- Orlando, FL +1.57% [+46K People]
- Charleston, SC +1.44% [+13K People]
- Average +0.70%
Q3 2025 Year-Over-Year Growth of Industrial Markets above $10B Asset Value by Population as Defined by CoStar1
1 Data collected from the CoStar Group.
Disclosures
This material is for informational purposes only and does not constitute investment, legal, or tax advice. Nothing herein should be construed as a recommendation or solicitation to buy or sell any security or investment. Any investment involves risk, including the possible loss of principal. Readers should consult their own advisors before making investment decisions.